

What is Vector and Vector Remap Language?
By suktech24, Sunday 25 Aug 2024, Estimated reading time : 15 mins
Vector is a high-performance observability data pipeline that puts organizations in control of their observability data.
This blog context is based on the workflow and the process of various security devices security logs ingestion, parsing, cleansing to enable analysis for the security engineer, platform engineers and analysts, and sending the logs to various destinations such as vistualisation dashboards, monitoring, etc.
- Observability Data pipeline
- 1.1 What is observability data pipeline?
- 1.2 What is Vector?
- 1.3 What are Metrics, Events, Logs and Traces?
- Components
- 2.1 Sources, Transforms and Sinks
- 2.2 Logs Events
- 2.3 Architecture Models
- 2.4 Configuration
- Vector Remap Language
- 3.1 Concepts
- 3.2 Features
- 3.3 Principles
- Get started with vector remap langugage and parse
- Summary
- References
1. Observability Data Pipeline
1.1 What is observability data pipeline?
An observability pipeline is a structured, automated process designed to aggregate, normalize, and route telemetry data—including logs, metrics, and traces—from various sources within a software environment to the appropriate observability and monitoring tools.
The comprehensive observability data pipeline is the key to an effective security operations center (SOC) to ingest various logs types from multiple devices, transform, enrich the fields for SOC analysts and detect any compromise with detections based on the fields.
“Data observability is a practice that helps organizations understand the full lifecycle of data, from ingestion to storage and usage, to ensure data health and reliability. Data observability involves monitoring and managing the internal state of data systems to gain insight into the data pipeline, understand how data evolves, and identify any issues that could compromise data integrity or reliability. At its core, data observability is about ensuring the availability, reliability, and quality of data.“
There are 5 Pillars of data observability They are described below as per Barr Moses.
- Freshness
- Freshness seeks to understand how up-to-date your data tables are, as well as the cadence at which your tables are updated. Freshness is particularly important when it comes to decision making; after all, stale data is basically synonymous with wasted time and money.
- Quality
- Your data pipelines might be in working order but the data flowing through them could be garbage. The quality pillar looks at the data itself and aspects such as percent NULLS, percent uniques and if your data is within an accepted range. Quality gives you insight into whether or not your tables can be trusted based on what can be expected from your data.
- Volume
- Volume refers to the completeness of your data tables and offers insights on the health of your data sources. If 200 million rows suddenly turns into 5 million, you should know. Unexpected increases or drops in the volume of data are often a good indication of an undetected issue.
- Schema
- Changes in the organization of your data, in other words, schema, often indicates broken data. Monitoring who makes changes to these tables and when is foundational to understanding the health of your data ecosystem. Observing the schema can help identify and flag unanticipated changes, such as the addition of new fields or deletion of existing fields.
- Lineage : Journey of data through a system
- When data breaks, the first question is always “where?” Data lineage provides the answer by telling you which upstream sources and downstream ingestors were impacted, as well as which teams are generating the data and who is accessing it. Good lineage also collects information about the data (also referred to as metadata) that speaks to governance, business, and technical guidelines associated with specific data tables, serving as a single source of truth for all consumers. Data lineage provides insights into where the data came from (upstream) and what is impacted (downstream). It plays a crucial role in root cause analysis as well as informing impacted systems about an issue as quickly as possible.
1.2. What is vector?
Vector is a high-performance observability data pipeline that puts organizations in control of their observability data. Vector enables organization to collect, transform and route the logs, metrics, and traces to any vendors they want.
1.3 What are Metrics, Events, Logs and Traces?
Telemtry are used to understand the system health, faults, troubleshooting, degradations, exploring dashboards, and alerting with the help various observability and monitoring tools. There are four types of telemetry data and they are listed below:
- Metrics
- The purpose of metrics is to inform observers about the health & operations regarding a component or system. A metric represents a point in time measure of a particular source, and data-wise tends to be very small.The compact size allows for efficient collection even at scale in large systems.
- Events
- Events in MELT are discrete occurrences with precise temporal and numerical values, enabling us to track crucial events and detect potential problems. It could be:
- Authentication events – successful, failed log in, account logouts
- Access control events
- Network events – port scanning, DDoS attempts, Firewall rule triggers
- System events
- Security software events, etc.
- Events in MELT are discrete occurrences with precise temporal and numerical values, enabling us to track crucial events and detect potential problems. It could be:
- Logs
- Log data inform observers about the discrete events that occurred within a component or a set of components. Just about every software component log information about its activities over time.
- Traces
- A trace refers to the entire path of a request or workflow as it progresses from one component of the system to another, capturing the end-to-end request flow through a distributed system.
- Therefore, it is a collection of operations representing a unique transaction handled by an application and its constituent services.
MELT comparison
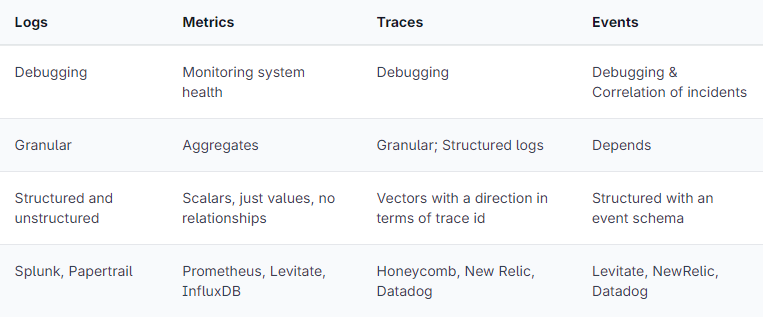
Sourced from Prathamesh Sonpatki, https://last9.io/blog/understanding-metrics-events-logs-traces-key-pillars-of-observability/
2. Components
Components enable to collect, transform and route data with ease.
Vector topologies are defined using a configuration file that tells it which components to run and how they should interact. Vector topologies are made up of three types of components.
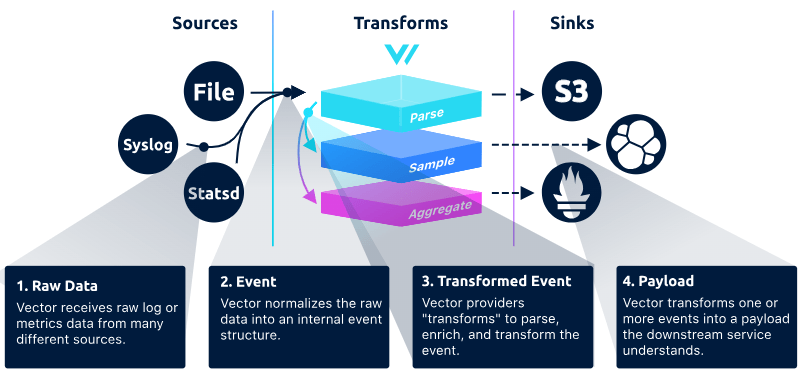
2.1 Sources, Transforms and Sinks
- Sources : collect or receive data from observability data sources into Vector
- Ingest, capture detailed log events
- Transforms : manipulate or change that observability data as it passes through your topology
- Sinks : send data onwards from Vector to external services or destinations
- Destination Examples
- Vistualisation Dashboards such as ElasticSearch Kibana, OpenSearch, Grafana
- Alerting and notification – SEIM
- Destination Examples
Each component has a unique id and is prefixed with the type of the component, for example sources for a source, transforms for a transforming, enriching parsing data and sinks for a destination.
2.2 Events – Logs and Metrics
Log events

Sourced from : https://vector.dev/docs/about/under-the-hood/architecture/data-model/log/
A Vector log event is a structured representation of a point-in-time event. It contains an arbitrary set of fields that describe the event. A key tenet of Vector is to remain schema neutral. This ensures that Vector can work with any schema, supporting legacy and future schemas as your needs evolve. Vector does not require any specific fields, and each component will document the fields it provides.
2.3 Architecture Model
Data Model
Source: Data Model, https://vector.dev/docs/about/under-the-hood/architecture/data-model/
Pipeline Model
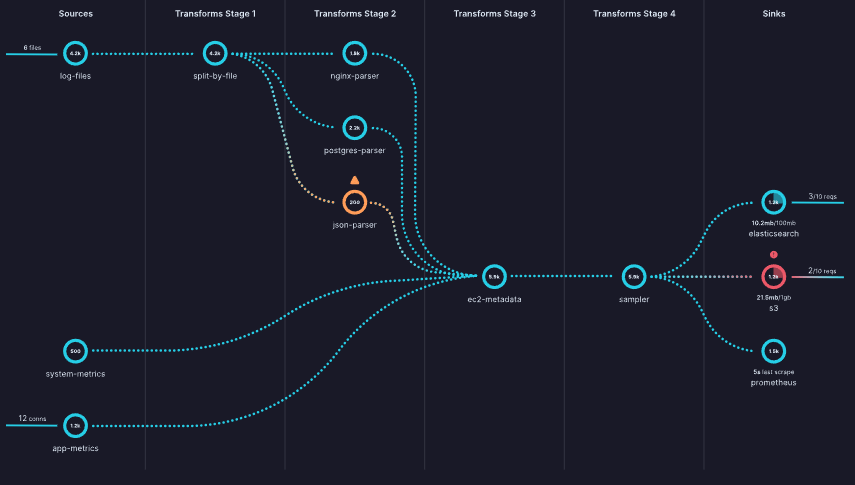
Vector’s pipeline model is based on a directed acyclic graph of components that contains independent subgraphs. Events must flow in a single direction from sources to sinks and can’t create cycles. Each component in the graph can produce zero or more events.
Source: Pipeline model, https://vector.dev/docs/about/under-the-hood/architecture/pipeline-model/
2.4 Configuration
A Vector pipeline is defined through a YAML, TOML, or JSON configuration file. For maintainability, many Vector users use configuration and data templating languages like Jsonnet or CUE.
Configuration is checked at pipeline compile time (when Vector boots). This prevents simple mistakes and enforces DAG properties. Below is an example of YAML and toml configuration.
YAML Configuration Example
api:
  enabled: true
  address: "0.0.0.0:8686"

sources:
  stdin:
    type: "stdin"

  # file_input:
  #   type: "file"
  #   include:
  #     - "./data/input/log.txt"
  #   read_from: "beginning"

transforms:
  parse_json_log:
    type: "remap"
    inputs:
      - "stdin"
    file: "./config/microsoft_defender_365_sample_log_parser.vrl"

sinks:
  sinks_metrics:
    inputs:
      - "parse_json_log"
    type: "file"
    path: "./data/output/vrl_parsed-%Y-%m-%d-%H-%M-%S.json"
    encoding:
      codec: "json"
      json:
        pretty: true
TOML Configuration Example
[api]
enabled = true
address = "0.0.0.0:8686"

[sources.stdin]
type = "stdin"

# [sources.file_input]
# type = "file"
# include = ["./data/input/log.txt"]
# read_from = "beginning"

[transforms.parse_json_log]
type = "remap"
inputs = ["stdin"]
file = "./config/microsoft_defender_365_sample_log_parser.vrl"

[sinks.sinks_metrics]
inputs = ["parse_json_log"]
type = "file"
path = "./data/output/vrl_parsed-%Y-%m-%d-%H-%M-%S.json"
encoding.codec = "json"
encoding.json.pretty = true
3. Vector
3.1 Concepts
The following concepts are fundamentals for understanding vector. They are listed as per alphabetical order and sourced from official documentation. https://vector.dev/docs/about/concepts/. If you want to read the concepts in progressive order, please go to the official concepts page.
- Buffers
- Sinks try to send events as fast as possible. If they are unable to keep up, they have a configurable buffer that will hold events until they can be sent. By default, Vector uses an in-memory buffer, but a disk-buffer is also available. Once a buffer fills up, the behavior is configurable.
- Backpressure
- If a sink’s buffer fills up and is configured to provide backpressure, that backpressure will propagate to any connected transforms, which will also propagate to the sources. The sources attempt to propagate backpressure to whichever system is providing data. The exact mechanism varies with the source. For example, HTTP sources may reject requests with an HTTP 429 error (Too Many Requests), or pull-based sources such as Kafka may slow down fetching new events.
- Components
- Component is the generic term for sources, transforms, and sinks. Components ingest, transform, and route events. You compose components to create topologies. Components enable you to collect, transform, and route data with ease
- Events
- Events represent the individual units of data in Vector.
- Logs
- A log event is a generic key/value representation of an event.
- Metrics
- Traces
- A trace event can be thought of as a special kind of log event. The components that support trace events are: the
datadog_agentsource, thedatadog_tracessink, and thesampleandremaptransforms.
- A trace event can be thought of as a special kind of log event. The components that support trace events are: the
- Logs
- Events represent the individual units of data in Vector.
- Pipelines
- A pipeline is a directed acyclic graph of components. Each component is a node in the graph with directed edges. Data must flow in one direction, from sources to sinks. Components can produce zero or more events.
- Roles
- A role is a deployment role that Vector fills in order to create end-to-end pipelines.
- Agent
- The agent role is designed for deploying Vector to the edge, typically for data collection.
- Aggregator
- The aggregator role is designed to collect and process data from multiple upstream sources. These upstream sources could be other Vector agents or non-Vector agents such as Syslog-ng.
- Agent
- A role is a deployment role that Vector fills in order to create end-to-end pipelines.
- Topology
- A topology is the end result of deploying Vector into your infrastructure. A topology may be as simple as deploying Vector as an agent, or it may be as complex as deploying Vector as an agent and routing data through multiple Vector aggregators.
- Vector Remap Language
- Vector Remap Language (VRL) is an expression-oriented language designed for transforming observability data (logs and metrics) in a safe and performant manner. It features a simple syntax and a rich set of built-in functions tailored specifically to observability use cases.
- Functions
- There are various built-in VRL functions. Refer to this link for a comprehensive list of all available functions. https://vector.dev/docs/reference/vrl/functions/
- Main function categories are listed below:
- Array
- Codec
- Coerce
- Convert
- Debug
- Enrichment
- Enumerate
- Path
- Cryptography
- IP
- Number
- Object
- Parse
- Random
- String
- System
- Timestamp
- Type
- VRL error – Compile Time and Runtime errors
- VRL is a fail-safe language, which means that a VRL program doesn’t compile unless every potential error is handled. Observability data is notoriously unpredictable and fail safety ensures that your VRL programs elegantly handle malformed data.
- https://vector.dev/docs/reference/vrl/errors/
4. Get started with vector remap langugage and parse
- Install the latest version of the Vector CLI
- Depending on your OS, download relevant version. For window, download zip file. https://packages.timber.io/vector/0.40.0
- Download –
vector-0.40.0-x86_64-pc-windows-msvc.zip
- Download –
- Unzip it and execute the command –
vector/bin/vector.exe --config your_vector_config.yml - You can also use VRL Playground, https://playground.vrl.dev/
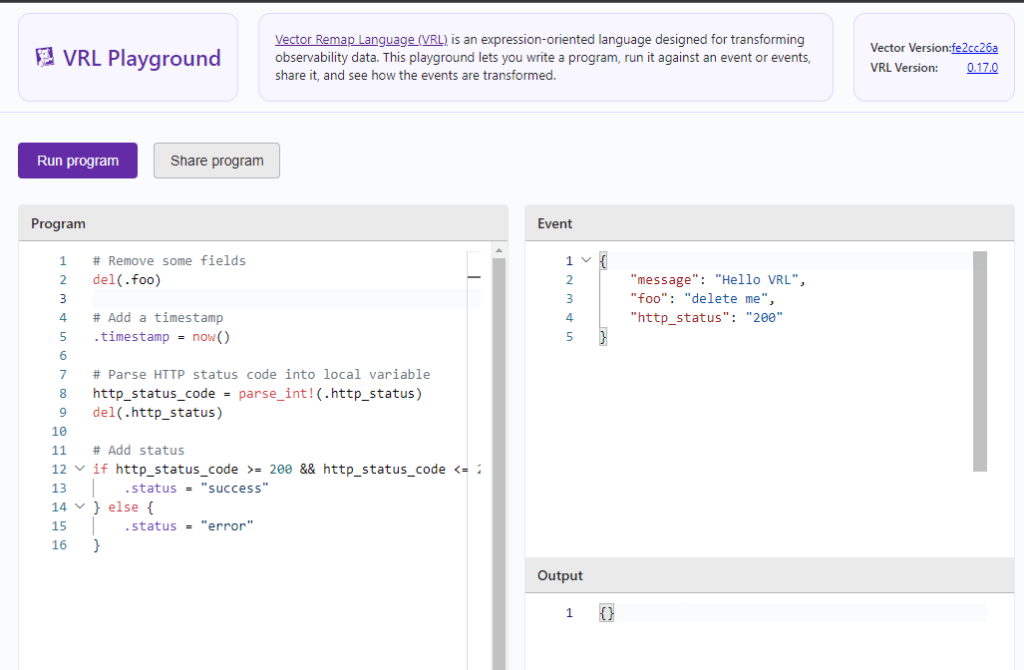
- Tips
- Start small
- Pick a log source type – e.g. JSON, CEF , Syslog
- Get the logsource sample – See example below
- Microsoft 365 Defender sample messages when you use the Microsoft Azure Event Hubs protocol
"{"time":"2021-07-21T00:57:23.0186119Z","tenantId":"abc12345-123a-123a-456b-abcdefg12345","operationName":"Publish","category":"AdvancedHunting-DeviceEvents","properties":{"AccountSid":null,"AccountDomain":null,"AccountName":null,"LogonId":null,"FileName":null,"FolderPath":null,"MD5":null,"SHA1":null,"FileSize":null,"SHA256":null,"ProcessCreationTime":null,"ProcessTokenElevation":null,"RemoteUrl":null,"RegistryKey":null,"RegistryValueName":null,"RegistryValueData":null,"RemoteDeviceName":null,"FileOriginIP":null,"FileOriginUrl":null,"LocalIP":null,"LocalPort":null,"RemoteIP":null,"RemotePort":null,"ProcessId":null,"ProcessCommandLine":null,"AdditionalFields":"{\"TaskName\":\"\\\\Microsoft\\\\Windows\\\\UpdateOrchestrator\\\\Schedule Maintenance Work\"}","ActionType":"ScheduledTaskUpdated","InitiatingProcessVersionInfoCompanyName":null,"InitiatingProcessVersionInfoProductName":null,"InitiatingProcessVersionInfoProductVersion":null,"InitiatingProcessVersionInfoInternalFileName":null,"InitiatingProcessVersionInfoOriginalFileName":null,"InitiatingProcessVersionInfoFileDescription":null,"InitiatingProcessFolderPath":null,"InitiatingProcessFileName":null,"InitiatingProcessFileSize":null,"InitiatingProcessMD5":null,"InitiatingProcessSHA256":null,"InitiatingProcessSHA1":null,"InitiatingProcessLogonId":999,"InitiatingProcessAccountSid":"S-1-5-18","InitiatingProcessAccountDomain":"m365defender","InitiatingProcessAccountName":"client-pc$","InitiatingProcessAccountUpn":null,"InitiatingProcessAccountObjectId":null,"InitiatingProcessCreationTime":null,"InitiatingProcessId":null,"InitiatingProcessCommandLine":null,"InitiatingProcessParentCreationTime":null,"InitiatingProcessParentId":null,"InitiatingProcessParentFileName":null,"DeviceId":"111122223333444455556666777788889999aaaa","AppGuardContainerId":"","MachineGroup":null,"Timestamp":"2021-07-21T00:55:44.2280946Z","DeviceName":"client-pc.example.net","ReportId":60533}}" );
- Microsoft 365 Defender sample messages when you use the Microsoft Azure Event Hubs protocol
- Start small and test progressively
- When you parse to test the log, the log must be in string format. Use JSON formatter to make the log into oneliner
- Parse the log and see whether the fields are getting extracted as expected
5. Summary
Vector is a high-performance observability data pipeline that enables organizations to collect, transform, and route telemetry data, including logs, metrics, and traces. It provides control over observability data and supports various data sources and destinations.
Vector Remap Language (VRL) is used for transforming observability data safely and efficiently. It has a simple syntax and built-in functions for observability use cases. It also ensures fail-safe operations by handling potential errors during compilation.
Key points:
- Observability data pipeline is crucial for effective security operations, ingesting and processing logs from multiple devices.
- Vector components include sources (data collection), transforms (data manipulation), and sinks (data routing).
- Vector supports different event types: logs, metrics, and traces.
- Configuration is done through YAML, TOML, or JSON files. YAML is most commonly used.
- To get started with VRL, you can either use the VRL playground or install Vector CLI (highly recommended), choose a log source and start experiment!
6. References
- Data Model, https://vector.dev/docs/about/under-the-hood/architecture/data-model/
- Introducing Dynatrace built-in data observability on Davis AI and Grail, Published January 31, 2024, Gordon Meyer, Hermann Hans and Bernd Greifeneder, https://www.dynatrace.com/news/blog/introducing-dynatrace-built-in-data-observability-on-davis-ai-and-grail/?utm_medium=social&utm_source=youtube&utm_campaign=anomalydetectionon5pillarsofdataobservability&utm_content=blog&utm_term=none
- Logs vs Metrics vs Traces, https://microsoft.github.io/code-with-engineering-playbook/observability/log-vs-metric-vs-trace/
- Understanding Metrics, Events, Logs and Traces – Key Pillars of Observability, Prathamesh Sonpatki, May 29th, 2023, https://last9.io/blog/understanding-metrics-events-logs-traces-key-pillars-of-observability/
- What is Data , https://www.datamation.com/big-data/what-is-data-observability/
- What is Data Observability? 5 Key Pillars To Know, Barr Moses , Updated Mar 01 2024, https://www.montecarlodata.com/blog-what-is-data-observability/
- Vector Docs, https://vector.dev/docs/
- Vector Remap Language, https://vector.dev/docs/reference/vrl/

Leave a comment